
Average Facebook Ads Conversion Rate in 2025 (By Industry + How to Improve It)
June 17, 2025

Written By Zain Zia

Edited By Katja Orel
Lead Editor, UGC Marketing

Fact Checked By Sebastian Novin
Co-Founder & COO, Influee
Want a better return on your Facebook ad spend? Start by focusing on one number: your conversion rate for Facebook.
In 2025, Facebook ad costs are climbing, and attention spans are shrinking. You can't just throw ads out and hope for the best.
You need data, a clear campaign objective, and a creative that converts.
In this guide, we'll break down the average Facebook ad conversion rate (CVR) in 2025, what’s considered good or bad, and how results vary by industry.
You’ll also learn why Facebook video ads sometimes underperform, and how to fix them with proven tactics to boost both CVR and ROI.
Keep reading if you want to turn those clicks into actual customers, without wasting your budget.
UGC videos starting at $72

2300+ Vetted Creators in Canada
TL;DR:
- The average Facebook ad conversion rate in 2025 is 8.95% across all industries
- A CVR over 10% is considered strong—3% or lower means you’ve got work to do
- Fitness, education, and employment sectors tend to convert the highest
- Low conversion rates are often caused by poor targeting, weak ad strategy, weak ad creative, or mismatched landing pages
- You can improve CVR with better ad creatives, tighter audience targeting, and faster-loading mobile-optimized landing pages
What Is the Average Conversion Rate of Facebook Ads?
In 2024, the average conversion rate for Facebook ads across all industries was 9.21%. By 2025, this rate dipped slightly to 8.95%.
That’s the average Facebook conversion rate across all industries and campaign types. Sure, it’s a helpful benchmark, but not a hard rule. Some industries crush it. Others...not so much.
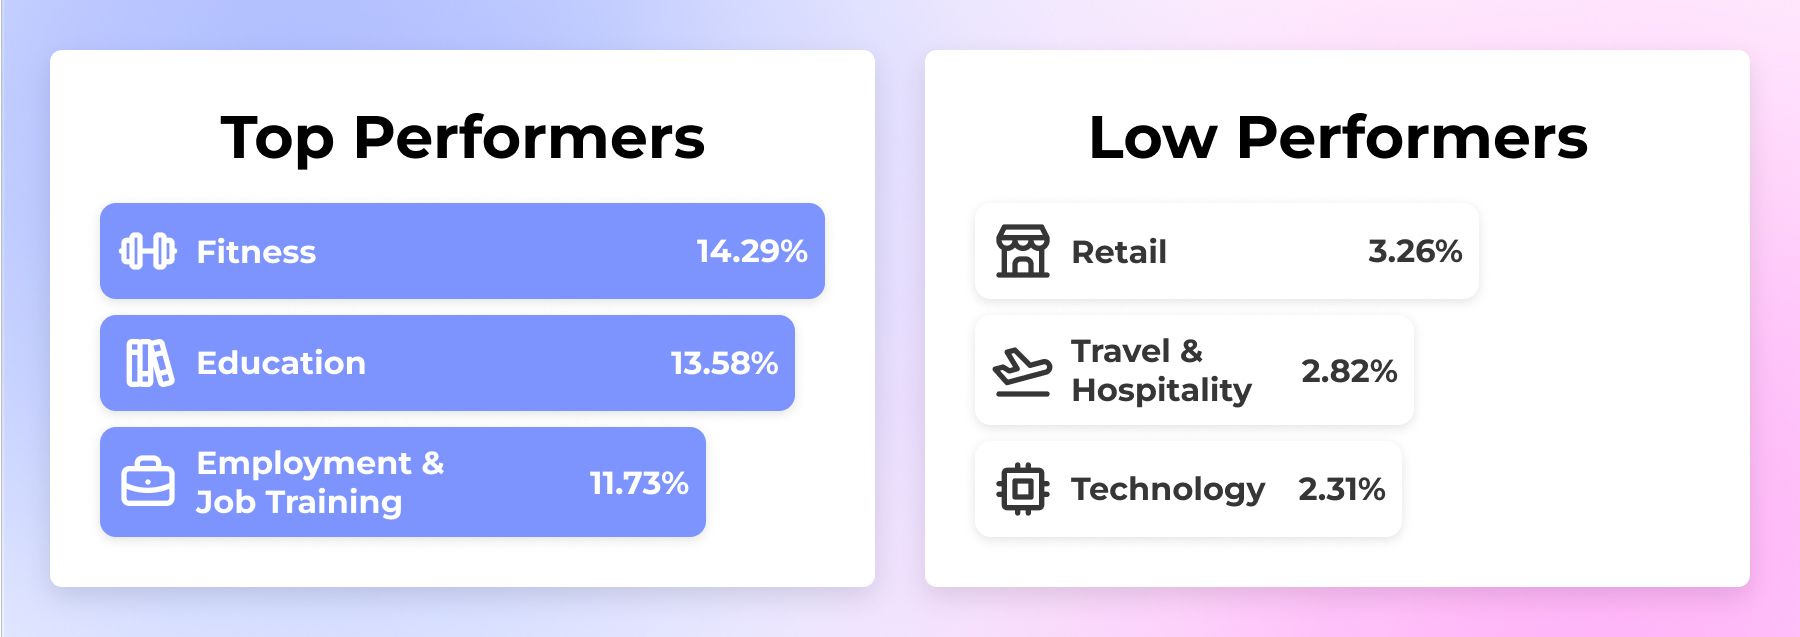
Here's a quick industry-wise breakdown of top and low performers in terms of average Facebook ad conversion rates:
Top performers:
- Fitness – 14.29%
- Education – 13.58%
- Employment & Job Training – 11.73%
Lower performers:
- Retail – 3.26%
- Travel & Hospitality – 2.82%
- Technology – 2.31%
So, if your conversion rate for Facebook ads is under 5%, it's not a cause for immediate concern, but it's definitely something you should look into. Numbers like these don’t just reflect performance; they highlight "where" your sales funnel might be falling apart.
Let’s break it down from the top.
What Is Conversion Rate?
Your conversion rate shows the percentage of people who take action after clicking your ad. That action might be a purchase, a sign-up, a download, or whatever conversion events your campaign is tracking.
Here’s the basic formula to calculate conversion rate:
(# of Conversions ÷ Total # of Visitors) x 100 = Conversion Rate (%)

UGC videos starting at $72

2300+ Vetted Creators in Canada
So, let's say, you get 2 sales from 50 clicks, that’s a 4% conversion rate.
But why do conversion rates matter? The answer is simple. Even a teeny tiny 1% bump in your conversion rate for Facebook ads can lead to major revenue gains. It’s one of those behind-the-scenes tweaks that can quietly drive serious growth.
What’s a Good Conversion Rate for Facebook Ads?
A “good” conversion rate for Facebook ads depends on your niche, campaign style, and offer. But generally speaking, the 2024 industry average for the social media platform was 9.21%.
So, if you're hitting 10% or more, you’re doing awesome. Industries like education, healthcare, and fitness can see higher CVRs. Top campaigns in these fields often hit 13–14%.
What’s Considered a Bad Conversion Rate?
Anything under 3% is considered a bad Facebook conversion rate. Even though it’s common in industries like legal, tech, and travel, that doesn’t mean it’s acceptable.
Low Facebook conversion rates usually trace back to a few issues. Common problems include a poorly targeted audience, weak ad campaigns or ad strategy, bad creative, or a clunky landing page. Fix just one of those, and you might see an immediate lift.
What Affects Facebook Ad Conversion Rates?
1. Target Audience
Your target audience is everything. It plays a significant role in how quickly people convert, how much they spend, and whether they stick around or disappear.
Here’s how it breaks down:
- B2C (Business-to-Consumer): These customers move fast. They're driven by emotion and convenience. Think impulse buys, limited-time offers, and “swipe-up now” urgency.
- B2B (Business-to-Business): Slower, but often worth more. These leads want facts, not fluff. Be ready for longer sales cycles and more nurturing along the way.
- Job Seekers: Often super engaged. If you’re offering tools or training, expect a strong response—especially if your message speaks to their current struggles.
The bottom line is that the better your target audience fit, the less heavy lifting your Facebook ad campaigns have to do. But, miss the mark, and even the best Facebook conversion campaign with a heavy advertising budget won't reach its desired campaign objective.
2. Product Price
Price has a big impact on how people behave.
- Low-ticket items (under $50) usually get quick results. People don’t spend a lot of time thinking it over. If it looks good and feels like a deal, they buy. These Facebook ads work best when you create urgency and show clear value right away.
- High-ticket products ($200 and up) take more convincing. Facebook users pause. They compare. They do their homework. To win them over, you’ll need to get a few key metrics right, like retargeting, social proof, and trust signals, like reviews, guarantees, or expert endorsements.
The bigger the price tag, the more trust you’ve got to build before the Facebook user's ready to click “Buy.”
3. Market Competition
The more crowded your niche, the tougher and more expensive it gets to stand out and meet your campaign objective.
- In high-competition markets, the costs of Facebook ad campaigns climb fast. You're basically fighting for attention in the same feed as everyone else. That means a higher average cost per click (average CPC) and no guarantee of conversion for your Facebook ad campaigns.
- Your ad frequency also plays a role here. If you’re showing up too often without variation, people tune out, hurting both performance and perception.
- Niche targeting is your secret weapon. Instead of trying to grab random attention, make sure you're offering the right solution to the right person at the right moment.
- Smaller audience, better odds. Pair that with a lightweight process for how to track competitor ads across Meta, TikTok, and Google. Consistent competitive scans make it easier to benchmark messaging, proof points, and offers
If you’re noticing a rise in Facebook advertising costs and weak campaign performance, it's time to zoom in. Get crystal clear on who you’re speaking to and the specific problem your Facebook ad is solving.
4. Buyer Journey Alignment
Not everyone clicks for the same reason. "Where" someone is in the buying process changes how they respond to your Facebook campaigns.
- Awareness stage: They’re just realizing there’s a problem. Grab their attention with value—think educational content, fun user-generated videos, and top-notch ad quality with high-quality images.
- Consideration stage: They’re weighing their options. This is your moment for comparison charts, testimonials, or limited-time offers. Experiment with ad placements and ad formats to see what clicks.
- Decision stage: They’re ready to act. Nudge them with urgency—clear CTAs, countdown discounts, or VIP perks. It's essential to get your ad placements right here.
If your message doesn’t match their mindset, they’ll scroll right past. But when it clicks? That’s when the conversions roll in.

How to Improve Your Conversion Rate
1. Nail Your Creative
Your creative is your first impression—and it needs to stop the scroll. If it doesn’t grab attention fast, even the best offer won’t matter.
- Test everything: Headlines, images, formats, hooks, CTAs. Sometimes, a small tweak is all it takes to see a big improvement.
- Use UGC: User-generated content (UGC) feels real, relatable, and trustworthy. It can boost your conversion rate by up to 300%—no fancy production needed. UGC statistics show just how powerful it can be for improving conversion rates.
- Avoid ad fatigue: If your results start to slip, your audience is likely getting bored. Rotate your creatives to keep things fresh and engaging. Even strong Facebook ads wear out after repeated exposure, especially if you're showing up more often than other advertisers targeting the same space.
The better your Facebook ad creative, the higher your average conversion rate will be. Strong visuals, relevant copy, and clear value are essential for driving conversions.
Pro Tip: Your creative’s quality ranking plays a big role in how often (and affordably) your ads get shown. Here’s how to improve low-quality ranking Facebook ads.
2. Match Landing Page to Ad
Getting the link click is just step one. If your landing page feels off or confusing, people will bounce fast.
- Keep it consistent: Your landing page should mirror your Facebook ad’s headline, visuals, and offer. If the ad promises a discount, show it right away. Don’t make them hunt for it.
- Use one clear CTA: Be direct. Whether it’s “Buy Now,” “Start Free Trial,” or “Get Access,” pick one campaign objective and make it obvious.
- Prioritize speed and mobile: Slow load times hurt conversions, and since most users are on mobile devices, your page needs to load fast and look great on smaller screens.
A disjointed experience between the Facebook ad and the landing page often leads to missed lead submissions or abandoned checkouts. Your goal is to guide users toward that desired action without distractions or confusion. One simple fix? Add UGC on website—reviews, photos, or testimonials that build trust and keep people moving toward your CTA.
3. Timing Matters
You could have the perfect Facebook ad—but if it hits at the wrong time, it won’t land.
- Lean into seasonal peaks: Run campaigns on your preferred advertising platforms when people are primed to buy. Think Black Friday, back-to-school season, or those New Year fitness surges. This strategy has become even more important over the past few years, as user behavior shifts rapidly with trends, news, and platform changes.
- Follow your own data: Look at past performance. When did your audience network engage with you the most? When did they actually make a purchase? Let those insights guide your budget and ad frequency.
When the right message meets the right moment, that’s when things really start to convert.
Facing delivery issues? Here’s what to do if your Facebook ads running but not spending.
4. Fix These Common Mistakes
Sometimes the problem isn’t what you’re doing—it’s what you’ve overlooked.
- Vague ad copy: If people can’t figure out what you’re offering in three seconds, they’ll bounce. Be clear. Be direct.
- Slow-loading pages: Every extra second kills your conversion rate for Facebook ads. Speed matters...a lot.
- Weak targeting: Broad audiences waste your budget. Focus on the people who actually want what you’re selling.
- Mismatch between ad and landing page: If your Facebook ad promises a “Free Trial” but the landing page doesn’t mention it, users lose trust.
- No social proof: Reviews, ratings, and testimonials help people feel confident clicking. Don’t leave them out.
- Missing or broken Meta Pixel: No pixel means no tracking. And without tracking your conversion events, you’re flying blind.
- Too many competing offers or features: If your ad tries to showcase every benefit or feature models, it can overwhelm the reader. Focus on one thing and do it well.
Fix these, and you’ll stop losing easy wins. This is especially important for small businesses competing against better-funded advertisers in the same feed.
Struggling with no conversions Facebook ads? Check out 9 solutions to troubleshoot the issue fast.
Facebook Ads Benchmarks (2025)
Curious how your Facebook advertising compares? Here are the 2025 Facebook Ads benchmarks to measure against:
Click-Through Rate (CTR)
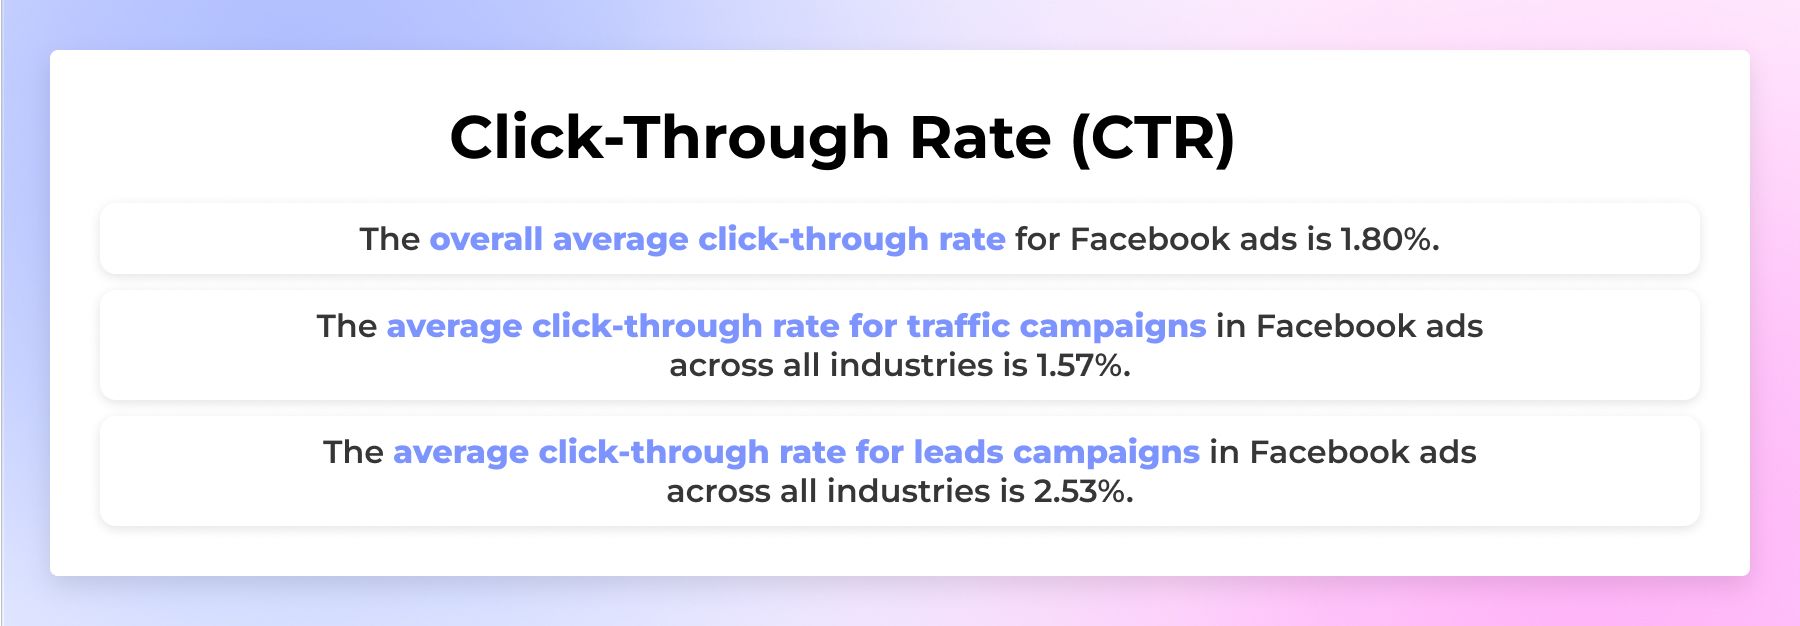
- The overall average click-through rate for Facebook ads is 1.80%.
- The average click-through rate for traffic campaigns in Facebook ads across all industries is 1.57%.
- The average click-through rate for leads campaigns in Facebook ads across all industries is 2.53%.
Your click-through rate tells you how well your ad grabs attention and gets people to take that desired action—clicking.
If you’re under 1.5%, it might be time to experiment with fresh creative, better ad placements, or tighter targeting. And if you're running both Facebook and Google Ads, compare performance. Some audiences respond better to visual-heavy social ads, while others prefer the directness of search ads.
Cost Per Click (CPC)
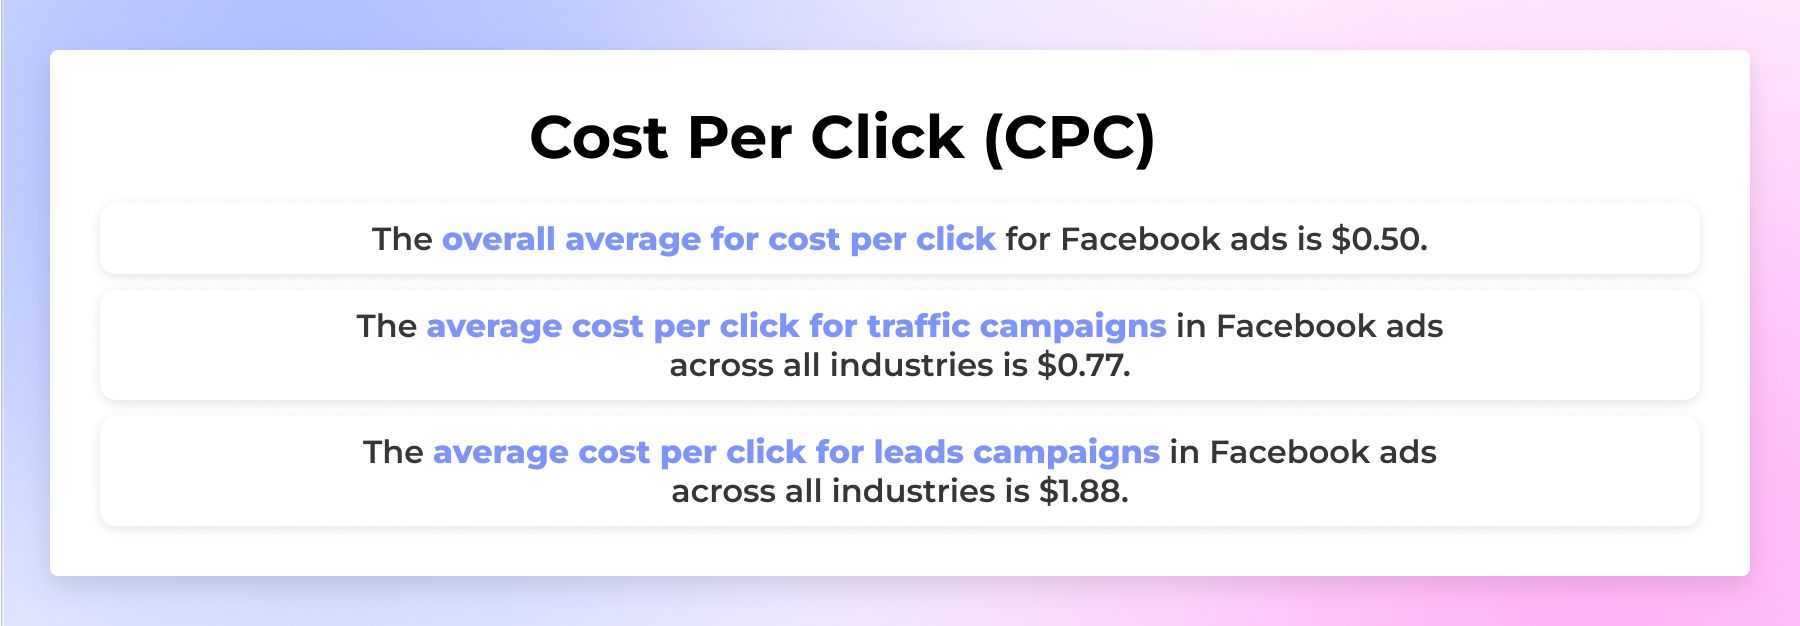
- The overall average for cost per click for Facebook ads is $0.50.
- The average cost per click for traffic campaigns in Facebook ads across all industries is $0.77.
- The average cost per click for leads campaigns in Facebook ads across all industries is $1.88.
Lower CPCs are great, sure—but only if those clicks turn into results. That’s where your campaign objective matters. If it’s not aligned with the message or audience, you could be wasting ad budget chasing the wrong outcome.
Also, watch for signs of ad fatigue. If you’re seeing click costs rise and performance dip, your audience may be tired of seeing the same message.
Cost Per Lead (CPL)

- The average cost per lead for leads campaigns in Facebook ads across all industries is $21.98.
- Here are a few lead gen campaign ranges by industry:
- Real Estate: $13.87
- Business Services: $16.95
- Industrial Services Industry: $24.53
- Health & Fitness Industry: $57.40
- Attorneys & Legal Services: $104.58
Big differences here. What gives? In short, some industries fall into the “impulse-friendly” bucket (think fitness or education), while others require more trust-building before people are ready to share info or convert.
So even if you're seeing a high CPL, zoom out. What’s your average conversion rate and customer value? If those are strong, the cost may still be worth it.
Average Conversion Rate by Industry
Overall average conversion rate: 8.95%
🔥 High-Performing
- Fitness Ads: 14.29%
- Education: 13.58%
- Employment & Job Training: 11.73%
- Healthcare: 11.00%
- Real Estate: 10.68%
These industries tend to crush it because they’re solving urgent problems with direct, personal impact. If you’re in one of these categories, aim high. A double-digit rate for Facebook ads is within reach.
Quick note: Personalized marketing experiences lead to positive results for 89% of advertisers. So, if you're in one of these industries, sky is the limit.
⚖️ Around Average
- Finance & Insurance: 9.09%
- Consumer Services: 9.96%
- Arts & Entertainment: 9.77%
- Home Improvement: 6.56%
Sitting at or around the average conversion rate? Good news: you’ve got room to grow. With better creative and a clearer offer, many businesses in this group can see sharp improvements.
🧊 Low-Performing
- Retail: 3.26%
- Travel & Hospitality: 2.82%
- Technology: 2.31%
- Industrial Services: 0.71%
In these categories, conversions are harder to earn. But they’re not impossible. Tighter funnels, retargeting, and well-placed trust signals can move the needle.
These insights are based on what Facebook’s monthly active users are clicking and converting on. And compared to Google Ads, where intent is typically higher, Facebook ad revenue depends more on timing, creativity, and audience fit.
Campaign Types and Conversion Rates
Not all campaigns are built to convert the same way—and that’s on purpose. Here's how the main types stack up:
Lead Generation Campaigns

- How they work: These use Facebook’s built-in lead forms or link out to a landing page to collect contact info.
- Average conversion rate: 8.95%
These are perfect for collecting email addresses, sign-ups, or early interest. Keep the form short, the offer clear, and the desired action obvious. Using lead generation forms can further streamline this process, making it easier to capture and organize contacts efficiently.
Conversion Campaigns

- How they work: These are optimized for deeper actions, like purchases, sign-ups, or bookings.
- Average conversion rate: 9.21%
This format is all about serious results. If you’re trying to scale sales or revenue fast, this is your go-to. Many digital marketing specialists rely on this format when ROI is the main goal.
App Install Campaigns

- How they work: Target people based on their behavior, device, or interest in similar apps.
- Average conversion rate: Varies a lot
Gaming apps often convert well, but utility apps struggle without social proof or reviews. You’ll need to test multiple angles and creatives—the same goes for Google Ads in this space, which often offer more direct intent but less visual impact.
Advanced Tactics To Improve Conversion Rates
1. Conversion Tracking
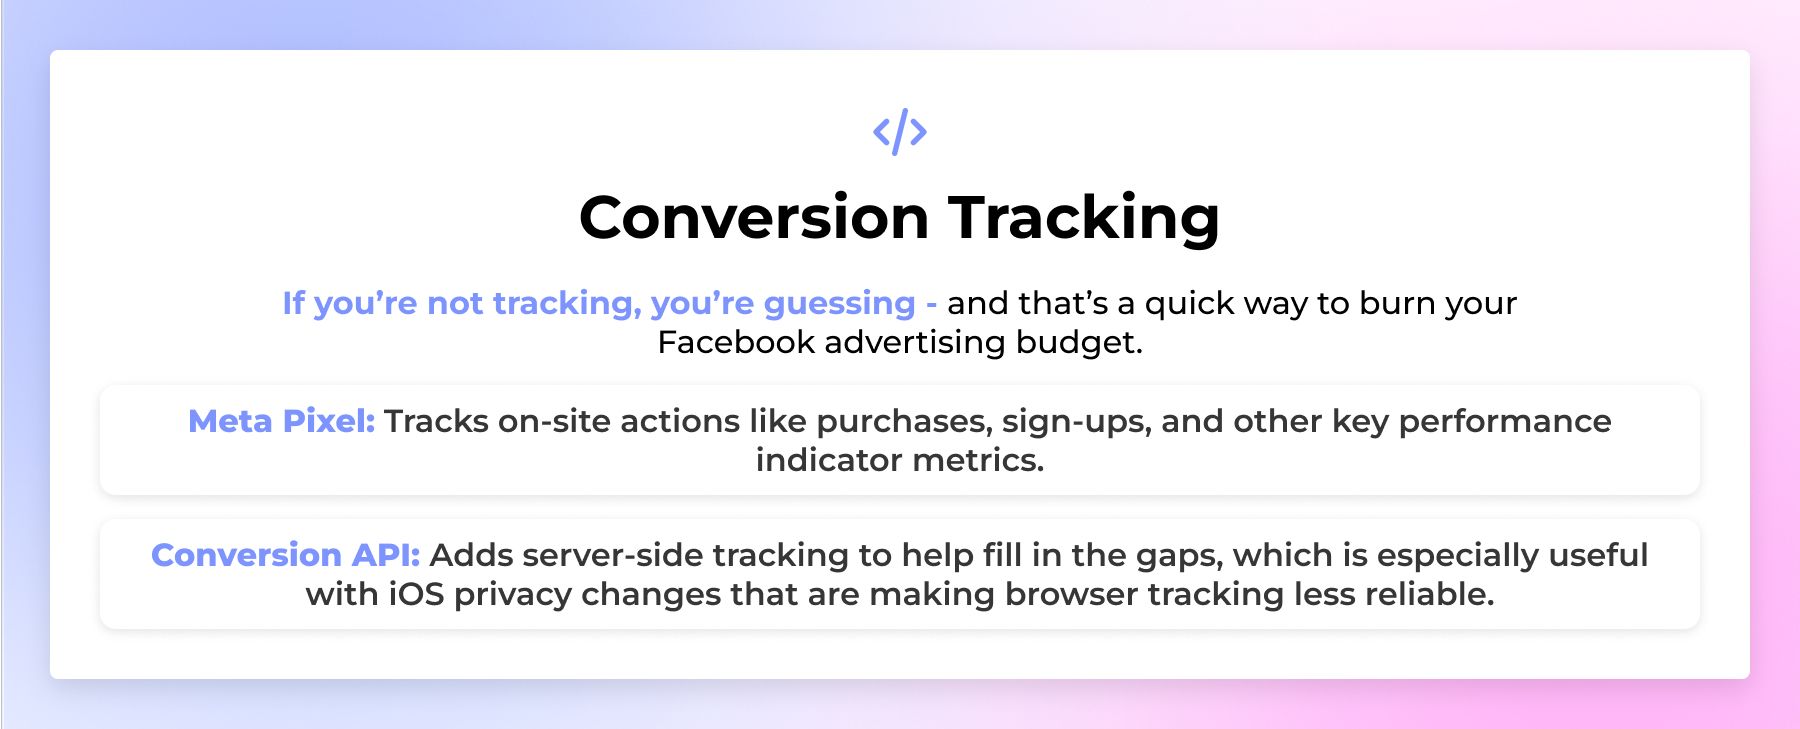
If you’re not tracking, you’re guessing—and that’s a quick way to burn your Facebook advertising budget. Use both the Meta Pixel and Conversion API to get the full picture.
- Meta Pixel: Tracks on-site actions like purchases, sign-ups, and other key performance indicator metrics.
- Conversion API: Adds server-side tracking to help fill in the gaps, which is especially useful with iOS privacy changes that are making browser tracking less reliable. The Facebook Conversion API can enhance tracking by connecting server data to Facebook's system.
You need solid data to make smart moves. Set this up right, and you’ll know exactly what’s working—and what’s not.
2. Test Relentlessly
Don’t guess—test. Assumptions cost money. Validation makes it.
- Try different audiences, placements, and creative formats
- Switch up your offers, experiment with shorter or longer ad copy, and test different CTAs
- Use tools like Madgicx or other automation platforms to test faster and smarter
If your target audience is reacting differently than expected, pivot fast. Over time, even a 1% lift in your average click-through rate can translate to serious revenue.
And keep an eye on the numbers. Median figures can be more realistic to benchmark against than wild case studies or outliers.
3. Use AI-Powered Tools
Want better results without burning out your team? Let AI do the heavy lifting.
- Jasper: Great for writing quick, scroll-stopping ad copy
- Canva, InVideo, and similar tools: Perfect for creating eye-catching visuals and videos in less time
- Influee AI UGC Videos that create branded UGC videos instantly
This is especially helpful for lean teams or small businesses that need to create high-performing creative fast without burning out.
Just remember: while AI helps you scale, your Facebook ad's creative still has to connect. Flashy, slick visuals won’t matter if your message misses the mark.
UGC videos starting at $72

2300+ Vetted Creators in Canada
A Recap
Conversion rates aren’t stats. They’re signals.
They show you what’s clicking, what’s stalling, and where your budget might be slipping through the cracks.
Use industry benchmarks. Learn from the best. And keep testing like it’s your job—because it kind of is.
At the end of the day, your Facebook ad spend is only as powerful as your conversion rate. So make every click count.
FAQ
Is $1000 enough for Facebook ads?
Yes—if you spend it smart. Stick to one clear goal, target a focused audience, and test a few different Facebook ad creatives. It’s not a massive budget, but it’s plenty to figure out what’s working (and what’s not).
Is a 30% conversion rate good?
Absolutely—it’s excellent. Rates that high usually come from warm audiences, strong retargeting, or super-specific offers. If you’re hitting 30%, you’re doing something right—so double down.
Is a 7% conversion rate good?
A 7% conversion rate is a solid one. The 2025 average for Facebook ads is 8.95%, so 7% is just below—but still strong. It's important to note that the travel and technology industries have lower conversion rates, averaging 2.82% and 2.31%, respectively. Also, B2B customers generally have lower conversion rates compared to B2C customers.
What is the average CVR for Facebook ads?
In 2025, the average conversion rate (CVR) for Facebook ads is 8.95% across all industries and campaign types.
What is a good ROI for Facebook ads?
A good ROI is 3:1 or higher, meaning you earn $3 for every $1 spent. The higher, the better, but steady, consistent returns matter more than the occasional big win.
What is a healthy ROAS?
A ROAS of 4.0 or higher is considered healthy for most brands. If you're below 2.0, it's a sign you should take a closer look at your targeting, creative, or overall offer.
What is a good CTR?
A Click-Through Rate of 1% or higher is the standard industry benchmark. For lead gen campaigns, top performers often see 2–3% or more. If you’re under 0.5%, it’s probably time to refresh your creative or rethink your targeting.
Table of Contents
What Is the Average Conversion Rate of Facebook Ads?
What Is Conversion Rate?
What’s a Good Conversion Rate for Facebook Ads?
What’s Considered a Bad Conversion Rate?
What Affects Facebook Ad Conversion Rates?
How to Improve Your Conversion Rate
Facebook Ads Benchmarks (2025)
Average Conversion Rate by Industry
Campaign Types and Conversion Rates
Advanced Tactics To Improve Conversion Rates
A Recap
FAQ

Work with UGC creators from  Canada
 Canada
Adam
Gander

Sheri
Oshawa

Taydra
New Westminster

Scott
Amherstburg
